Cloud migration has matured from a hopeful cost play into a disciplined business transformation with measurable financial returns. Yet many organisations still struggle to show more than anecdotal savings. If you need to build a board‑ready case, this guide shows you how to quantify cloud migration benefits, produce an ROI you can defend, and track payback post‑go‑live.
What “provable ROI” looks like in 2025
Provable ROI means you can tie outcomes to baseline metrics, quantify each benefit stream, and reconcile the model to your actual cloud bills and operational KPIs. At a minimum, you should be able to show:
- A clear baseline, on‑premise cost and performance before migration
- A forward TCO, including cloud services, licences, support, and the cost of change
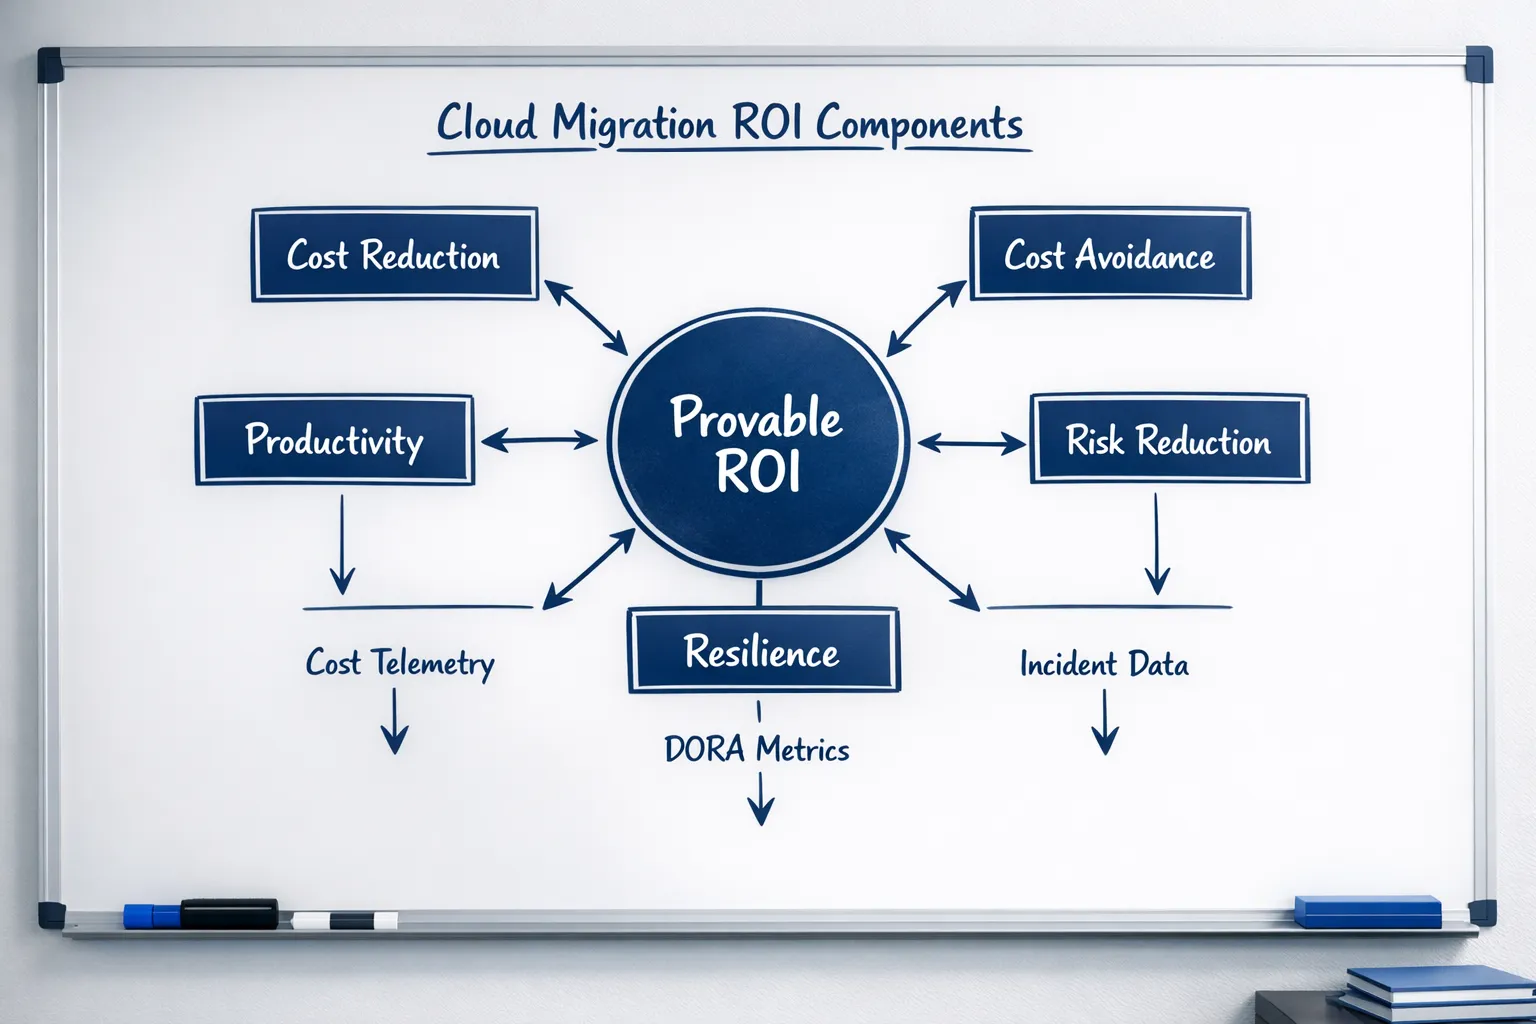
- Benefit streams split into cost savings, cost avoidance, productivity, resilience, and risk reduction
- A payback period and sensitivity analysis for best, expected, and conservative cases
- Ongoing measurement that proves the model was realistic, not optimistic
Tip, use unit economics so the story stays true even as volumes change. Examples include cost per order, cost per API call, cost per monthly active user, and cost per terabyte processed.
The five benefit streams you can measure
Cloud migration benefits go beyond infrastructure line items. These are the categories you can model credibly.
1) Infrastructure cost reduction
What it is, replacing fixed, peak‑sized hardware with elastic, usage‑based services and modern instance families.
How to measure, compare normalised compute, storage, and network consumption pre and post, and rightsize instances, adopt Savings Plans or committed use discounts, and consolidate licences where possible.
Evidence from Tasrie projects,
- 30 percent monthly reduction on AWS EKS through spot and scheduling, documented in our EKS cost reduction case study.
- 30 percent overall cost reduction for finance applications after an AWS migration, see migrating finance applications to AWS.
2) Cost avoidance
What it is, avoiding datacentre renewals, hardware refreshes, support contracts, and large one‑off capital expenditures.
How to measure, list the next 3 years of unavoidable on‑premise spend you would incur without migrating, then discount to present value.
Evidence, a Saudi travel platform eliminated an unnecessary enterprise API gateway during a monitoring upgrade, saving about 100,000 USD over three years, see API gateway cost optimisation story.
3) Productivity and speed
What it is, faster environments, automated deployments, and platform services that let teams ship more, with fewer defects.
How to measure, track DORA metrics, lead time, deployment frequency, change failure rate, and mean time to restore, developer time saved on environment provisioning, pipeline maintenance, and rework.
Evidence, an investment firm moved trading bots to Kubernetes with end‑to‑end CI and now deploys multiple times per day instead of monthly, read DevOps for trading bots.
4) Resilience and downtime reduction
What it is, multi‑AZ and multi‑region design, auto scaling, and managed services that reduce incidents and shorten outages.
How to measure, baseline incident count, MTTR, and downtime cost per hour. After migration, measure SLO attainment and error budget burn.
Evidence, a healthcare organisation moved to AWS with auto scaling and multi‑region DR and saw fewer security incidents and improved uptime, see healthcare cloud migration.
5) Security and compliance risk reduction
What it is, managed security controls, encryption by default, robust identity, and auditable changes reduce the likelihood and impact of incidents.
How to measure, model risk reduction as avoided loss, multiply the change in annual breach probability by estimated loss per incident. For regulated sectors, include audit effort reduction.
Evidence, Tasrie IT Services holds ISO 27001 certification, which helps clients trust the controls used in sensitive migrations, read our ISO 27001 announcement.
A practical framework to baseline, model, and prove ROI
Follow this sequence so your ROI model stays aligned with reality.
Step 1, establish a defensible baseline
- Catalogue all on‑premise costs, hardware, power, cooling, racks, licences, support, maintenance, DR sites, and staff time for operations
- Capture performance and reliability baselines, MTTR, incident count, release frequency, environment lead time
- Choose unit metrics relevant to your product, cost per transaction, order, API call, data pipeline run
Step 2, build your TCO and benefits model
- TCO inputs, cloud services, managed platforms, licences, third‑party tools, migration effort
- Benefits, map expected savings to the five categories and define how you will measure each in production
- Financials, calculate ROI, payback, and NPV
- ROI, (Total Benefits − Total Costs) divided by Total Costs
- Payback period, months until cumulative net benefit is greater than zero
- NPV, discount future cash flows at your hurdle rate
For structure and communication, you can borrow techniques from other automation domains that publish transparent ROI case models. One useful reference is this case‑model approach to ROI and payback periods in the travel industry, which shows how to quantify manual work avoided, disruption costs averted, and ancillary revenue. The same modelling discipline applies to cloud migrations.
Step 3, run a pilot to validate assumptions
- Select a contained workload with meaningful spend or pain
- Implement a secure landing zone, VPC or VNet design, identity, logging, backups, and guardrails
- Migrate the pilot with blue‑green or canary cutover so you can compare A versus B
- Measure, reconcile cloud bills and performance against your model
Step 4, scale by waves, then optimise and govern
- Wave plan by business domains or affinity groups, reduce cross‑team coupling and risk
- Automate with Infrastructure as Code and GitOps for repeatability, policy checks, and audit trails
- Apply FinOps, tagging, cost allocation, budgets, anomaly alerts, and ongoing rightsizing. For hands‑on guidance, see our AWS cloud cost optimisation guide.
How to instrument your migration for evidence
- Cost and usage, enable detailed billing export, cost and usage reports, and consistent tags for business unit, application, environment, team
- Performance and reliability, use application performance monitoring, synthetic checks, and SLO dashboards. Capture MTTR and error budgets continuously
- Delivery performance, implement CI and CD with traceable deployment events and change failure rate
- Security posture, track patch cadence, vulnerability metrics, and security incident counts
The point is simple, if it is not instrumented, it did not happen. Instrument first, migrate second.
Sample ROI worksheet you can adapt
| Benefit category | What to measure | How to quantify | Example Tasrie proof |
|---|---|---|---|
| Infrastructure cost reduction | Instance hours, storage GB, data transfer, per unit | Rightsize and apply committed discounts, compute before and after per unit cost | EKS cost reduction, 30 percent |
| Cost avoidance | Hardware refresh, DC lease, vendor licences | Sum avoided 3 year cash flows, discount to present value | API gateway removal saved about 100,000 USD |
| Productivity and speed | Lead time, deployments per day, time to provision | Convert hours saved to monetary value at loaded rates | Trading bots moved to Kubernetes, daily releases |
| Resilience | Incident frequency, MTTR, downtime cost per hour | Avoided downtime equals decrease in hours times cost per hour | Healthcare migration improved uptime and DR |
| Security and compliance | Incidents, audit effort, patch time | Reduced probability times impact, plus audit hours saved | ISO 27001 controls and processes |
Your numbers will differ, the table shows how to structure the measurement and cite real evidence.
Worked example, a conservative payback model
Assumptions for a mid‑size SaaS product,
- Baseline on‑premise spend, 850,000 GBP per year all‑in, datacentre, hardware support, licences, maintenance, staff time
- Migration investment, 420,000 GBP one‑off including internal time and external experts
- Post‑migration cloud run rate, 620,000 GBP per year after rightsizing and a 1 year discount plan
- Productivity benefit, 8,000 developer hours saved per year from automated environments and CI, at 70 GBP per loaded hour equals 560,000 GBP value, apply a 40 percent realisation factor equals 224,000 GBP recovered capacity
- Resilience benefit, historic downtime 12 hours per year at 20,000 GBP per hour, improved design halves downtime equals 120,000 GBP benefit
Year 1 net benefit,
- Savings equals 850,000 minus 620,000 equals 230,000
- Additional benefits equals 224,000 plus 120,000 equals 344,000
- Total Year 1 benefit equals 574,000
- Net of migration investment equals 574,000 minus 420,000 equals 154,000
Payback, achieved in Year 1 month 9. ROI after 24 months,
- Total benefits equals 574,000 plus 574,000 equals 1,148,000
- Total costs equals 420,000 plus 620,000 equals 1,040,000 for Year 1, and plus 620,000 equals 1,660,000 for Year 2 run cost
- If you attribute only the investment to ROI (common for transformation), ROI equals, 1,148,000 minus 420,000 divided by 420,000 equals 173 percent
This is an illustrative model to show structure, you should plug in your own volumes, rates, and risk factors.
Real outcomes that boards recognise
- 30 percent lower cloud run rate with no service disruptions, a hybrid spot strategy, Pod Disruption Budgets, and proactive failover, read the AWS EKS cost reduction story
- 30 percent cost reduction and 70 percent downtime reduction for finance applications after moving to AWS with autoscaling and managed databases, see finance cloud migration
- Improved scalability and reliability for a luxury real estate CRM with AWS EKS, HPA, cluster autoscaler, and Argo CD, documented in our CRM on AWS case study
If your board asks for comparable references, these stories demonstrate savings, reliability, and platform discipline together.
Common risks that dilute ROI, and how to avoid them
- Lift and shift without rightsizing, mitigate with a rightsizing wave immediately after stabilization, then evaluate managed services for databases and messaging
- Untracked spend and shared accounts, mitigate with a tagging standard, cost allocation rules, budgets, and anomaly detection from day one
- Long cutovers and hidden downtime, mitigate with blue‑green and canary releases, synthetic testing, and rehearsed runbooks
- Overly broad scope, mitigate with wave planning, target high‑value domains first, and keep a weekly benefits tracker
- Skills and governance gaps, mitigate with a platform team, landing zone patterns, and an automation first approach
For a broader operating model and platform discipline, see our guide on cloud native fundamentals.

What to include in a board‑ready business case
- Executive summary in one page, the why, the value, the risk controls, and the payback window
- Baseline, the current run cost, performance, resilience, and delivery metrics
- Investment profile, internal and external costs by phase, with a contingency
- Benefits by category, cost reduction, avoidance, productivity, resilience, security, each with measurement method and owner
- Delivery plan, 90 day milestones, landing zone, pilot, first wave, and optimisation gates
- Risk register and mitigations, including change management and skills enablement
- Measurement plan, telemetry, tagging, dashboards, and a monthly benefits review cadence
Frequently asked questions
How fast can organisations typically see cloud migration ROI? Many mid‑size organisations see payback inside 12 to 18 months when the migration is paired with rightsizing and FinOps. A pilot can validate savings in 4 to 8 weeks.
Is a lift and shift ever the right first step? Yes, when time to exit a datacentre is the priority. Just plan a modernisation and rightsizing phase immediately after stabilisation so savings are captured.
How do we quantify developer productivity gains without double counting? Convert reclaimed hours to a conservative realisation percentage, for example 30 to 50 percent, and ensure you do not also count the same gain as revenue uplift unless you can attribute it.
What if our workloads are highly variable? Use unit metrics, cost per transaction or per API call. Model both peak and average scenarios and include committed discounts with an on‑demand buffer.
Which tools do we need to prove ROI? Start with cost and usage exports, tagging, application performance monitoring, and SLO dashboards. Add budget alerts and anomaly detection. The key is consistent telemetry, not tool count.
Can Tasrie help if we are already in the cloud but costs are high? Yes. Many engagements start with a cost and reliability assessment and a 90 day optimisation plan. See our AWS cost optimisation guide for a preview of the approach.
Turn your plan into measurable outcomes
Tasrie IT Services helps engineering leaders ship faster, improve reliability, and reduce costs using cloud native platforms, DevOps, and automation. If you need a migration plan with a provable ROI, we can help you baseline, model, pilot, and instrument the journey, then operate with FinOps and SRE discipline.
Ready to build a board‑ready case, request a consultation at Tasrie IT Services to quantify your cloud migration benefits and design a payback‑backed roadmap.