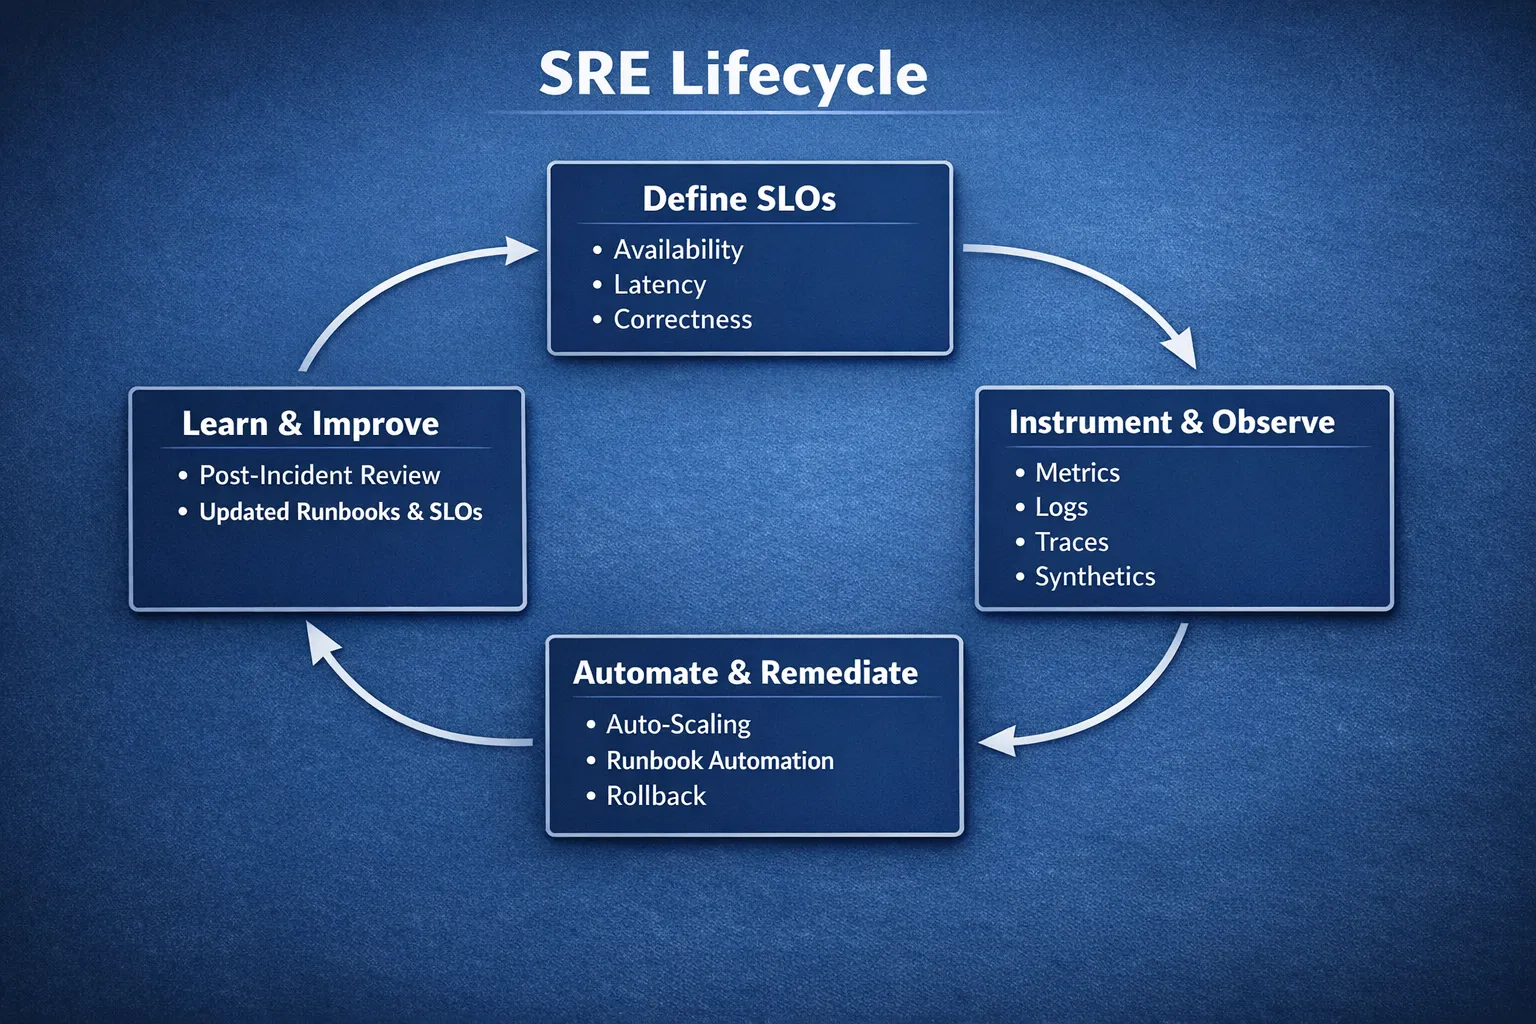
High‑performing cloud operations are not an accident. They are the outcome of three disciplines working together every day, SLOs that define reliability, runbooks that encode operational knowledge, and automation that acts faster and safer than humans alone. In this guide, we share a practical blueprint to implement cloud operations management that reduces incidents, speeds recovery, and lowers cost, with examples drawn from real projects and field‑tested practices.
Start with SLOs that reflect user experience
Service Level Objectives, and the SLIs that power them, are the backbone of modern cloud operations management. They express reliability in the language of your users, not your servers. The objective is not 100 percent uptime, it is predictable, valuable service within a defined error budget.
- SLI, a measurable indicator of service health, for example percentage of successful requests or p95 latency for the checkout API.
- SLO, the target level for that indicator over a rolling window, for example 99.9 percent success over 30 days.
- Error budget, the permissible level of unreliability in the same window, for example about 43 minutes of unavailability in 30 days for a 99.9 percent SLO.
Design principles:
- Choose SLIs that map to critical user journeys, not infrastructure internals.
- Prefer distribution metrics such as p95 or p99 latency over averages.
- Use rolling windows that match business cadence, most teams use 28 to 30 days.
- Publish SLOs and review them, keep them accurate as the product evolves.
| SLI category | Typical SLI | Why it matters |
|---|---|---|
| Availability | Success ratio, non 5xx over total requests | Users care that actions succeed |
| Latency | p95 or p99 end to end latency | Slow is often as bad as down |
| Correctness | Error rate by domain rule, for example failed payments | Measures business outcomes, not just HTTP codes |
| Freshness | Data age, time since last successful pipeline run | Critical for analytics and feeds |
| Throughput | Requests per second or jobs per minute | Capacity and back pressure signals |
| Durability | Successful writes acknowledged and retrievable | Protects against silent data loss |
For deeper patterns and examples, Google’s SRE books remain an authoritative reference, especially on burn‑rate based alerting and error budgets, see Google’s SRE Workbook.
Turn SLOs into the only alerts that matter
The best paging signals answer a single question, will we violate the SLO soon if we do nothing. Alerting on CPU at 85 percent or disk at 70 percent is noisy and rarely maps to user pain. Alert on error budget burn rate instead.
A simple approach:
- Page when fast burn indicates imminent breach, for example the service is consuming budget quickly over a short window. This catches acute failures.
- Ticket when slow burn indicates a trend, for example budget will be exhausted this week without action. This catches chronic issues without waking anyone at night.
Example for an HTTP service using metrics, error_rate is the ratio of 5xx to all requests over a short window. Compare that to your allowed error budget to compute burn rate.
error_rate = sum(rate(http_requests_total{status=~"5.."}[5m]))
             /
             sum(rate(http_requests_total[5m]))

burn_rate = error_rate / allowed_error_budget_fraction
Combine short and long windows to reduce false positives. The same pattern applies to latency SLIs using p95 or p99 quantiles.
Runbooks that accelerate diagnosis and recovery
Runbooks turn institutional knowledge into repeatable, auditable action. They guide responders under pressure and enable safe automation later. A useful runbook is concise, decision oriented and verifiable.
Recommended structure:
- Context, short description, when to use it.
- Preconditions, known symptoms, dashboards to check, pager alerts that trigger it.
- Impact, which users or regions are affected, severity scale.
- Owner, primary team and escalation path.
- Diagnosis steps, ordered steps to identify root cause.
- Remediation steps, the smallest safe change first, include rollback.
- Validation, objective checks that the fix worked, for example SLI recovers.
- Evidence, links to graphs, logs, traces, change IDs.
- Post incident, what to capture for the review and how to improve the runbook.
Skeleton you can copy today:
Title: p95 latency above SLO on checkout API
Context: Triggered by SLO burn alert for latency. Affects conversions at peak.
Preconditions: p95 > 300 ms for 10 mins, error budget burn trending up.
Impact: Web and mobile checkout for EU region. Severity: Major.
Owner: Payments Platform Team. Escalate to Duty Architect if >30 mins.
Diagnosis:
  1. Open service dashboard (latency, saturation, errors, traffic).
  2. Check recent deploys and feature flags.
  3. Inspect dependency health (DB, cache, third party gateways).
Remediation:
  1. Roll back the last deployment if latency spike correlates with deploy time.
  2. Scale out API pods by +2 and DB read replicas by +1 if saturation observed.
  3. Toggle feature flag "smart-pricing" off if external gateway latency is elevated.
Validation: p95 < 300 ms for 10 mins, error burn normalises, orders complete.
Rollback: Undo scaling and restore feature flags after stability for 60 mins.
Evidence: Grafana panel links, trace IDs, change ID, incident ticket.
Post-incident: Create task to add query cache and optimise slow SQL.
Automate the runbook, add guardrails, then raise the bar
Automation is where reliability and cost benefits compound. Start small, automate the safest, high value steps first, and always keep a human override.
An automation maturity ladder:
- Manual with guidance, responders follow runbooks precisely.
- Human in the loop, ChatOps commands run prebuilt scripts with confirmation.
- Guardrailed auto runbooks, alerts trigger remediation playbooks that verify outcomes and roll back on failure.
- SLO driven automation, actions are conditional on burn rate and business calendars, for example do not scale up during planned maintenance.
- Continuous optimisation, the platform learns safe changes over time through experiments and post incident learning.
Patterns that pay off quickly:
- SLO aware autoscaling, scale on queue depth, concurrency and latency, not only CPU. We implemented event driven autoscaling with KEDA to protect clinical traffic spikes for a UK healthcare provider, see Implementing auto‑scaling with KEDA.
- Cost efficient resilience, blend spot with on demand instances and enforce Pod Disruption Budgets to keep SLOs intact while cutting spend, see 30 percent EKS cost reduction with spot optimisation.
- Fleetwide observability and alerting, centralised exporters, discovery and alert routing eliminate blind spots, see Prometheus based monitoring across 400 servers.
Operating model, people and sustainable on‑call
Strong cloud operations management is also about people. Keep rotations sustainable, protect focus time, and train together through game days. Document clear ownership per service, so pages reach the right team with the right context.
Wellbeing matters for reliability, rested engineers make better decisions. Teams often encourage healthy habits alongside process improvements. For inspiration on balanced routines outside work, you can explore curated wellness products and insights that promote a holistic approach to wellbeing.
Tasrie IT Services operates with audited security practices, including ISO 27001, which helps align operations with compliance and data protection needs, see ISO 27001 certification.
A pragmatic tooling blueprint
You do not need a dozen new platforms to get started. Aim for a small, integrated stack that covers measurement, action and evidence.
| Capability | Examples | Output |
|---|---|---|
| Observability | Prometheus, Grafana, SigNoz, cloud metrics | SLIs, burn rate calculations, dashboards |
| SLO as code | OpenSLO spec, Sloth, pipeline checks | Versioned SLOs, CI gating |
| Alert routing | Alertmanager, PagerDuty, Opsgenie | On call schedules, deduped incidents |
| Runbook repo | Git, Markdown, internal docs | Single source of truth for operations |
| Automation | GitOps tools, AWS Systems Manager, Azure Automation, Rundeck | Safe, auditable remediation |
| ChatOps | Slack with bots, MS Teams | Human in the loop control surface |
| Evidence | Change logs, trace links, incident timelines | Faster reviews and compliance proofs |
If you are building from scratch, start with what you already have and expand deliberately. For guidance on designing or modernising your monitoring stack, see our approach in Ensuring peak performance with multi‑level monitoring.
To define SLOs declaratively and keep them close to code, consider adopting an SLO specification, such as OpenSLO, in the same repositories as your services.
90‑day implementation plan
0 to 30 days, establish the basics:
- Pick two critical user journeys and define three SLOs maximum, one availability, one latency, one correctness.
- Instrument services to emit SLIs, tie to dashboards and traces.
- Create runbook skeletons for the top five incidents of the last quarter.
- Configure burn rate alerts, page only for fast burn, ticket for slow burn.
- Socialise the operating model, service ownership, escalation, weekend coverage.
31 to 60 days, automate the first wins:
- Convert one or two high confidence runbook steps into guardrailed automation.
- Introduce ChatOps to run common actions with approval in Slack or Teams.
- Pilot event driven autoscaling for one workload where SLOs suffer at peak, our healthcare KEDA project is a reference.
- Add synthetic checks for the critical journeys to complement SLIs.
- Start post incident reviews with action items tied to SLOs and runbooks.
61 to 90 days, scale and prove value:
- Adopt SLO as code in CI and require an SLO and runbook per new service.
- Expand burn rate alerting to more services, add out of hours quiet hours rules.
- Integrate automation with change logs for audit, include rollbacks by default.
- Publish a simple scorecard to leadership, SLO compliance, error budget spent, MTTD, MTTR and on call load. For a compact framework, see Cloud service management KPIs that matter.
- Tune costs without hurting SLOs, enforce showback and right sizing in clusters, we often apply practices from Kubernetes FinOps, cut cluster costs fast.
Common anti‑patterns to avoid
- 100 percent SLO targets, they are unachievable and hide meaningful trade offs.
- Alert storms on infrastructure metrics, page on burn rate and user symptoms first.
- Runbooks that are wikis of ideas, make them stepwise, decision oriented and short.
- Automation without guardrails, always verify effects and include rollbacks.
- Hidden toil, if an action is safe and repeated, automate it and track the savings.
- SLOs that are not versioned, keep SLOs close to code and review them quarterly.
Proof that the approach works
- Improved resilience during unpredictable traffic, event driven autoscaling added headroom for critical healthcare services without manual intervention, read the KEDA autoscaling story.
- Real savings with reliability intact, a blended spot strategy saved 30 percent on EKS while SLOs held steady, see EKS spot optimisation.
- Fleet visibility and faster response, a large B2B provider moved to a modern Prometheus based stack across 400 plus servers, cutting time to detect and fix, see multi layer monitoring.
These outcomes are consistent with the model in our broader guidance on platform operations and modern managed services, see Managed IT Services, 2025 expectations and Cloud engineering best practices for high scale teams.
The bottom line
Cloud operations management only compounds when all three pillars reinforce each other. SLOs focus attention, runbooks reduce cognitive load and variation, and automation scales good practice without scaling headcount. Start small, measure what matters, and iterate.
If you want experienced hands to accelerate this journey, Tasrie IT Services helps teams implement SLOs, build living runbooks, and automate safely across AWS, Azure and Kubernetes. We focus on measurable outcomes, faster releases, better reliability and lower cost. Reach out to discuss an assessment, a pilot, or to review your current operating model.