Cloud systems rarely fail in obvious ways. A customer sees a slow checkout, a background job silently retries for 30 minutes, and your dashboard shows “CPU is fine”. In 2026, the teams who debug fastest are the ones who can answer one question quickly: what changed, where, and why?
That is exactly the problem OpenTelemetry (OTel) was designed to solve. It gives you a vendor-neutral way to generate and ship traces, metrics, and logs with consistent context, so you can investigate incidents without stitching together disconnected tools.
This guide focuses on the practical parts: the minimum architecture you need, how to roll out instrumentation safely, and the pitfalls that typically make Cloud Observability noisy or expensive.
What OpenTelemetry actually is (and what it is not)
OpenTelemetry is an open standard and set of libraries, APIs, SDKs, and collectors for producing and exporting telemetry data. It is a Cloud Native Computing Foundation (CNCF) project and has become the de-facto instrumentation layer across modern observability stacks.
OpenTelemetry is not an observability backend. It does not store your data or provide dashboards by itself. Instead, it standardises how telemetry is produced and shipped, typically using OTLP (OpenTelemetry Protocol) to send data to an OpenTelemetry Collector, and then onwards to your chosen backend(s).
The three signals, plus the glue that makes them useful
| Signal | Best for | Typical question it answers | Common pitfall |
|---|---|---|---|
| Traces | Request journeys across services | “Which dependency caused this latency?” | Over-instrumentation or missing context propagation |
| Metrics | Trends and alerting | “Is error rate rising across the fleet?” | High cardinality labels that explode cost |
| Logs | Detailed events and forensics | “What happened right before the failure?” | Unstructured logs with no trace correlation |
| Context propagation | Correlation across signals | “Do these logs relate to this trace?” | Inconsistent headers, broken propagation across async boundaries |
If you take one thing away: traces and logs without consistent context are just more data.
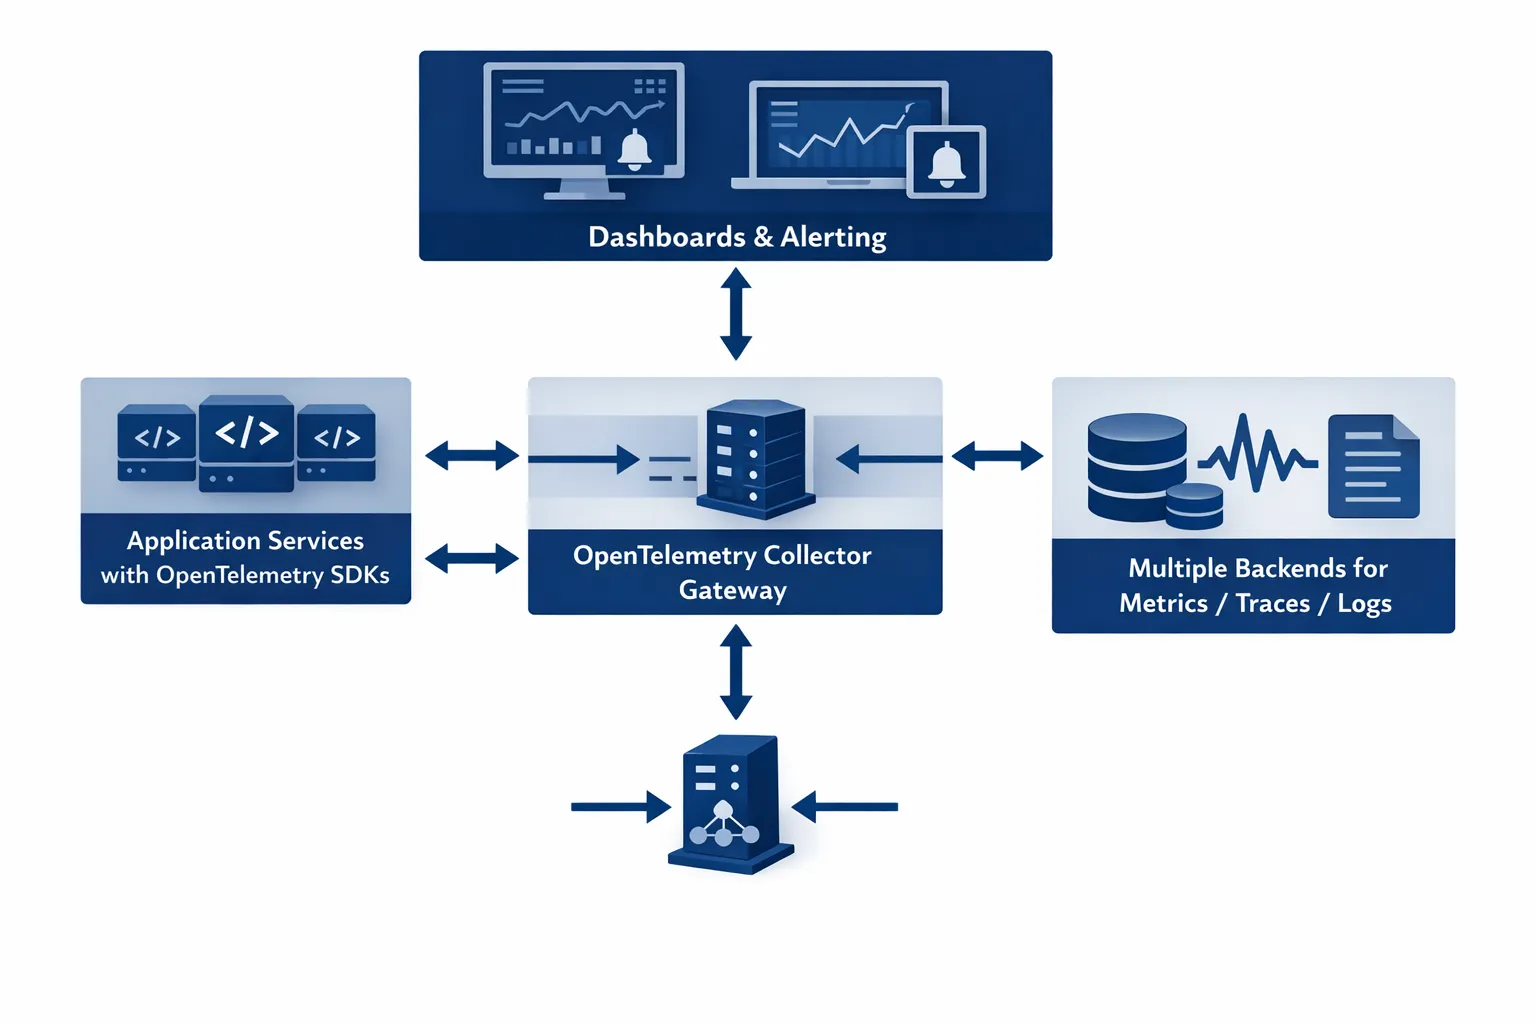
A reference architecture for cloud observability with OpenTelemetry
OpenTelemetry deployments tend to converge on a simple pattern:
- Applications emit telemetry using OTel SDKs (and sometimes auto-instrumentation).
- Telemetry is sent to an OpenTelemetry Collector (agent, gateway, or both).
- The collector enriches, samples, filters, and exports data to one or more backends.
Collector deployment options (what teams choose in practice)
| Pattern | Where the collector runs | Pros | Cons | Best for |
|---|---|---|---|---|
| Agent | On every node (often a DaemonSet in Kubernetes) | Low latency, resilient to backend outages, local enrichment | More instances to manage | Kubernetes, large fleets |
| Gateway | As a central service (Deployment/VM) | Centralised control, easier tail sampling and routing | Extra network hop, can become bottleneck without HA | Multi-team, multi-cluster, regulated environments |
| Agent + Gateway | Both | Best balance, strong buffering and policy enforcement | More moving parts | Most production platforms |
If you run Kubernetes, the agent + gateway pattern is usually the most robust. You keep node-local collection for resilience, and enforce organisation-wide policies (sampling, routing, PII controls) at the gateway.
Before you instrument anything: decide what “good” looks like
OpenTelemetry is powerful, but it can also create a lot of telemetry quickly. Start by clarifying your target outcomes:
- Incident response: reduce MTTR by correlating logs, traces, metrics.
- Reliability: define SLOs and alert on user-impact (not CPU).
- Delivery confidence: spot regressions after releases (error rate, latency shifts).
- Cost control: set budgets for telemetry volume and cardinality.
A practical way to keep scope tight is to pick one critical user journey (for example “checkout” or “create invoice”) and instrument end-to-end first.
Step 1: Instrument services without creating a telemetry mess
Prefer semantic conventions and consistent resource attributes
OpenTelemetry provides semantic conventions for naming spans, metrics, and attributes. Following them improves cross-tool compatibility and prevents dashboards from becoming “per team, per service, per opinion”.
At minimum, standardise these resource attributes across all services:
service.nameservice.versiondeployment.environment(for exampleprod,staging)cloud.providerandcloud.region(where applicable)
Auto-instrumentation vs manual instrumentation
Auto-instrumentation is a strong starting point (especially for HTTP frameworks, DB clients, messaging). Manual instrumentation is still needed for business-critical spans.
A pragmatic approach:
- Use auto-instrumentation to get baseline HTTP and dependency traces.
- Add manual spans around key operations (payment authorisation, feature flag evaluation, cache misses).
- Treat span attributes like an API, review them in code reviews.
Minimal example: manual span around a risky operation
The exact syntax varies by language, but the pattern is the same: create a span, add key attributes, record exceptions.
Span: "payment.authorise"
Attributes:
  payment.provider = "stripe"
  order.value_gbp = 129.00
  user.tier = "pro"
On error:
  record exception + set status ERROR
Keep attributes focused on what helps you debug. Avoid embedding large payloads or anything that could contain PII.
Step 2: Get trace and log correlation right (so investigations are fast)
Correlation is where OpenTelemetry becomes operationally valuable.
Trace context propagation
Most ecosystems default to the W3C Trace Context (traceparent and tracestate) which is widely supported. If you have custom gateways, older proxies, or legacy messaging, validate that these headers:
- pass through unchanged
- are not overwritten
- survive async hops (queues, cron jobs, background workers)
The W3C Trace Context specification is the reference if you need to troubleshoot edge cases.
Logging: include trace identifiers
Whether you use structured logging or a log pipeline, ensure your logs contain trace correlation fields (names vary by ecosystem):
trace_idspan_id
Then your log backend can pivot from a failing trace to the exact log lines that explain the failure.
Step 3: Deploy the OpenTelemetry Collector with sane defaults
Think of the Collector as your “telemetry control plane”. It lets you:
- route data to multiple destinations (useful during migrations)
- enforce sampling policies
- redact sensitive fields
- buffer during backend outages
A practical collector pipeline (conceptual)
- Receivers: OTLP (gRPC/HTTP)
- Processors: batch, memory limiter, attributes/resource enrichment, sampling
- Exporters: metrics to Prometheus remote_write or OTLP, traces to a tracing backend, logs to your log store
Example collector configuration (trimmed)
This is intentionally simplified to show the building blocks.
receivers:
  otlp:
    protocols:
      grpc:
      http:

processors:
  memory_limiter:
    check_interval: 1s
    limit_mib: 512
  batch:
    timeout: 5s

exporters:
  otlp:
    endpoint: your-backend-otlp-endpoint:4317
    tls:
      insecure: false

service:
  pipelines:
    traces:
      receivers: [otlp]
      processors: [memory_limiter, batch]
      exporters: [otlp]
Production hardening usually adds:
- multiple replicas for gateways, with load balancing
- tail sampling (if you need it)
- attribute filtering and PII controls
- authentication (mTLS or token-based, depending on environment)
Step 4: Sampling strategies that protect both cost and debuggability
Sampling is not optional at scale. The goal is to keep enough data to debug real issues, without storing every successful request.
Head sampling (simple, cheap)
Head sampling happens at the start of a trace, typically in the SDK. It is lightweight but can miss rare failures.
Good starting point:
- 100% in dev/staging
- 1% to 10% in production (varies by traffic)
- always sample when:
- request fails (HTTP 5xx)
- latency exceeds threshold
Tail sampling (smarter, more compute)
Tail sampling decides after seeing more of the trace, which lets you keep:
- slow traces
- error traces
- specific customer-tier traces (if you tag safely)
Tail sampling is usually implemented in the Collector gateway and requires enough memory/CPU to hold traces briefly.
A realistic “first production” policy
- Head sample at a low base rate to protect services.
- Tail sample on the gateway for errors and p95/p99 latency outliers.
- Revisit after two weeks, using actual telemetry volume.
Step 5: Control cardinality before it controls your bill
High-cardinality attributes (for example user IDs, request IDs, email addresses) can explode metric series and indexing costs.
A simple hygiene table teams use in reviews:
| Attribute type | Example | OK for metrics? | OK for traces? | Recommendation |
|---|---|---|---|---|
| Stable low-cardinality | deployment.environment=prod | Yes | Yes | Standardise across all services |
| Bounded values | payment.provider=stripe | Usually | Yes | Fine, but keep values controlled |
| Unbounded identifiers | user.id=... | No | Sometimes | Avoid in metrics, be cautious in traces |
| Sensitive data | email, name, address | No | No | Do not emit, redact at source if possible |
If you need per-customer visibility, prefer:
- sampling by customer tier (bounded)
- separate debug modes in non-production
- short-lived targeted sampling windows during incidents
Step 6: Kubernetes specifics (what tends to break first)
Kubernetes makes OpenTelemetry easier to roll out, but also introduces new failure modes.
Common gotchas:
- Missing
service.namebecause multiple workloads share a base image and forget to set it. - Sidecar/service mesh interactions where proxies rewrite headers or terminate TLS.
- Noisy nodes: a single runaway pod can saturate the node-local collector if you do not set limits.
Operational best practices:
- Run an agent collector as a DaemonSet with memory limits.
- Run a gateway collector as a Deployment with horizontal scaling.
- Use Kubernetes metadata enrichment carefully, it is useful but can add cardinality.
If your current stack is Prometheus-based, OpenTelemetry can complement it rather than replace it. Many teams keep Prometheus for infrastructure metrics and add OTel for application tracing and richer context. (Tasrie IT has existing practical Prometheus content if you want a refresher, see Install Prometheus on Kubernetes.)
Step 7: Security and compliance considerations (especially in regulated workloads)
Observability data often contains operationally sensitive information, and sometimes personal data by accident.
Key controls to implement early:
- Transport security: TLS between SDKs and collectors, and between collectors and backends.
- Authentication: do not expose OTLP endpoints without auth.
- Data minimisation: avoid collecting headers, request bodies, or full SQL statements unless you have a strong reason.
- Redaction: implement collector processors to drop or hash sensitive fields.
- Retention and access: align trace/log retention to compliance and incident needs.
If you are aligning to ISO 27001 or similar frameworks, observability pipelines should be treated like any other production data pipeline: threat model it, least-privilege it, and audit it.
Step 8: Prove value with a “first dashboard” that matches how incidents happen
A practical first set of views:
- Service overview: request rate, error rate, latency (p50/p95/p99)
- Dependency latency breakdown (database, cache, external API)
- Recent deploy markers (correlate changes to regressions)
- Top failing endpoints with linked traces
When teams modernise customer-facing applications (marketing sites, checkout flows, SaaS front-ends), it can be worth coordinating observability alongside the rebuild, so you get performance and telemetry improvements together. If you need a delivery partner on the web build side, a team like Brother Web Design’s custom web design can help modernise the front-end while your platform team standardises telemetry behind the scenes.
A practical rollout plan for engineering teams
A rollout succeeds when it is incremental and measurable.
Phase A: Foundation (days to weeks)
- Deploy Collector (agent + gateway)
- Set org-wide naming and attribute conventions
- Ship data to a non-production backend first
Phase B: One critical service path (1 to 2 sprints)
- Instrument one user journey end-to-end
- Add log correlation
- Add an incident-ready dashboard
Phase C: Scale out safely (ongoing)
- Add services gradually
- Introduce sampling and attribute filtering
- Document standards and add CI checks where possible
If you are migrating log agents or consolidating telemetry collection, it is also worth noting the industry trend toward unified agents built around OpenTelemetry. Grafana Alloy is one example, and Tasrie IT covers it in How to migrate from Promtail to Grafana Alloy.
Frequently Asked Questions
Is OpenTelemetry only for microservices? No. It helps monoliths too, especially for correlating logs and identifying slow internal operations. Microservices benefit more because traces show cross-service latency and failure propagation.
Do I need to replace Prometheus to use OpenTelemetry? Not necessarily. Many teams keep Prometheus for infrastructure metrics and use OpenTelemetry for traces and application-level telemetry, exporting metrics in a compatible format where it makes sense.
Where should sampling happen, in the SDK or the Collector? Start with simple head sampling in the SDK for baseline control, then add Collector-based tail sampling if you need smarter selection (errors, slow traces) and can support the extra processing.
What is the biggest mistake teams make with OpenTelemetry? Treating it like “install and forget”. Without conventions, sampling, and attribute discipline, telemetry quickly becomes noisy, expensive, and hard to use during incidents.
Can OpenTelemetry help with cloud cost optimisation? Indirectly, yes. Traces and metrics can reveal inefficient dependencies, retries, chatty services, and hot endpoints. The more direct cost lever is controlling telemetry cardinality and retention.
How long does a production-grade rollout usually take? A basic foundation can be done in days, but a production-grade rollout (standards, sampling, dashboards, and team adoption) typically takes several sprints, depending on service count and maturity.
Need help implementing OpenTelemetry without slowing delivery?
Tasrie IT Services helps engineering teams roll out cloud observability in a way that improves reliability and shortens incident response, without creating runaway telemetry costs. If you want a pragmatic review of your current monitoring stack, collector architecture, sampling strategy, and Kubernetes instrumentation approach, talk to Tasrie IT Services about an OpenTelemetry adoption plan tailored to your platform and compliance needs.